Prometheus

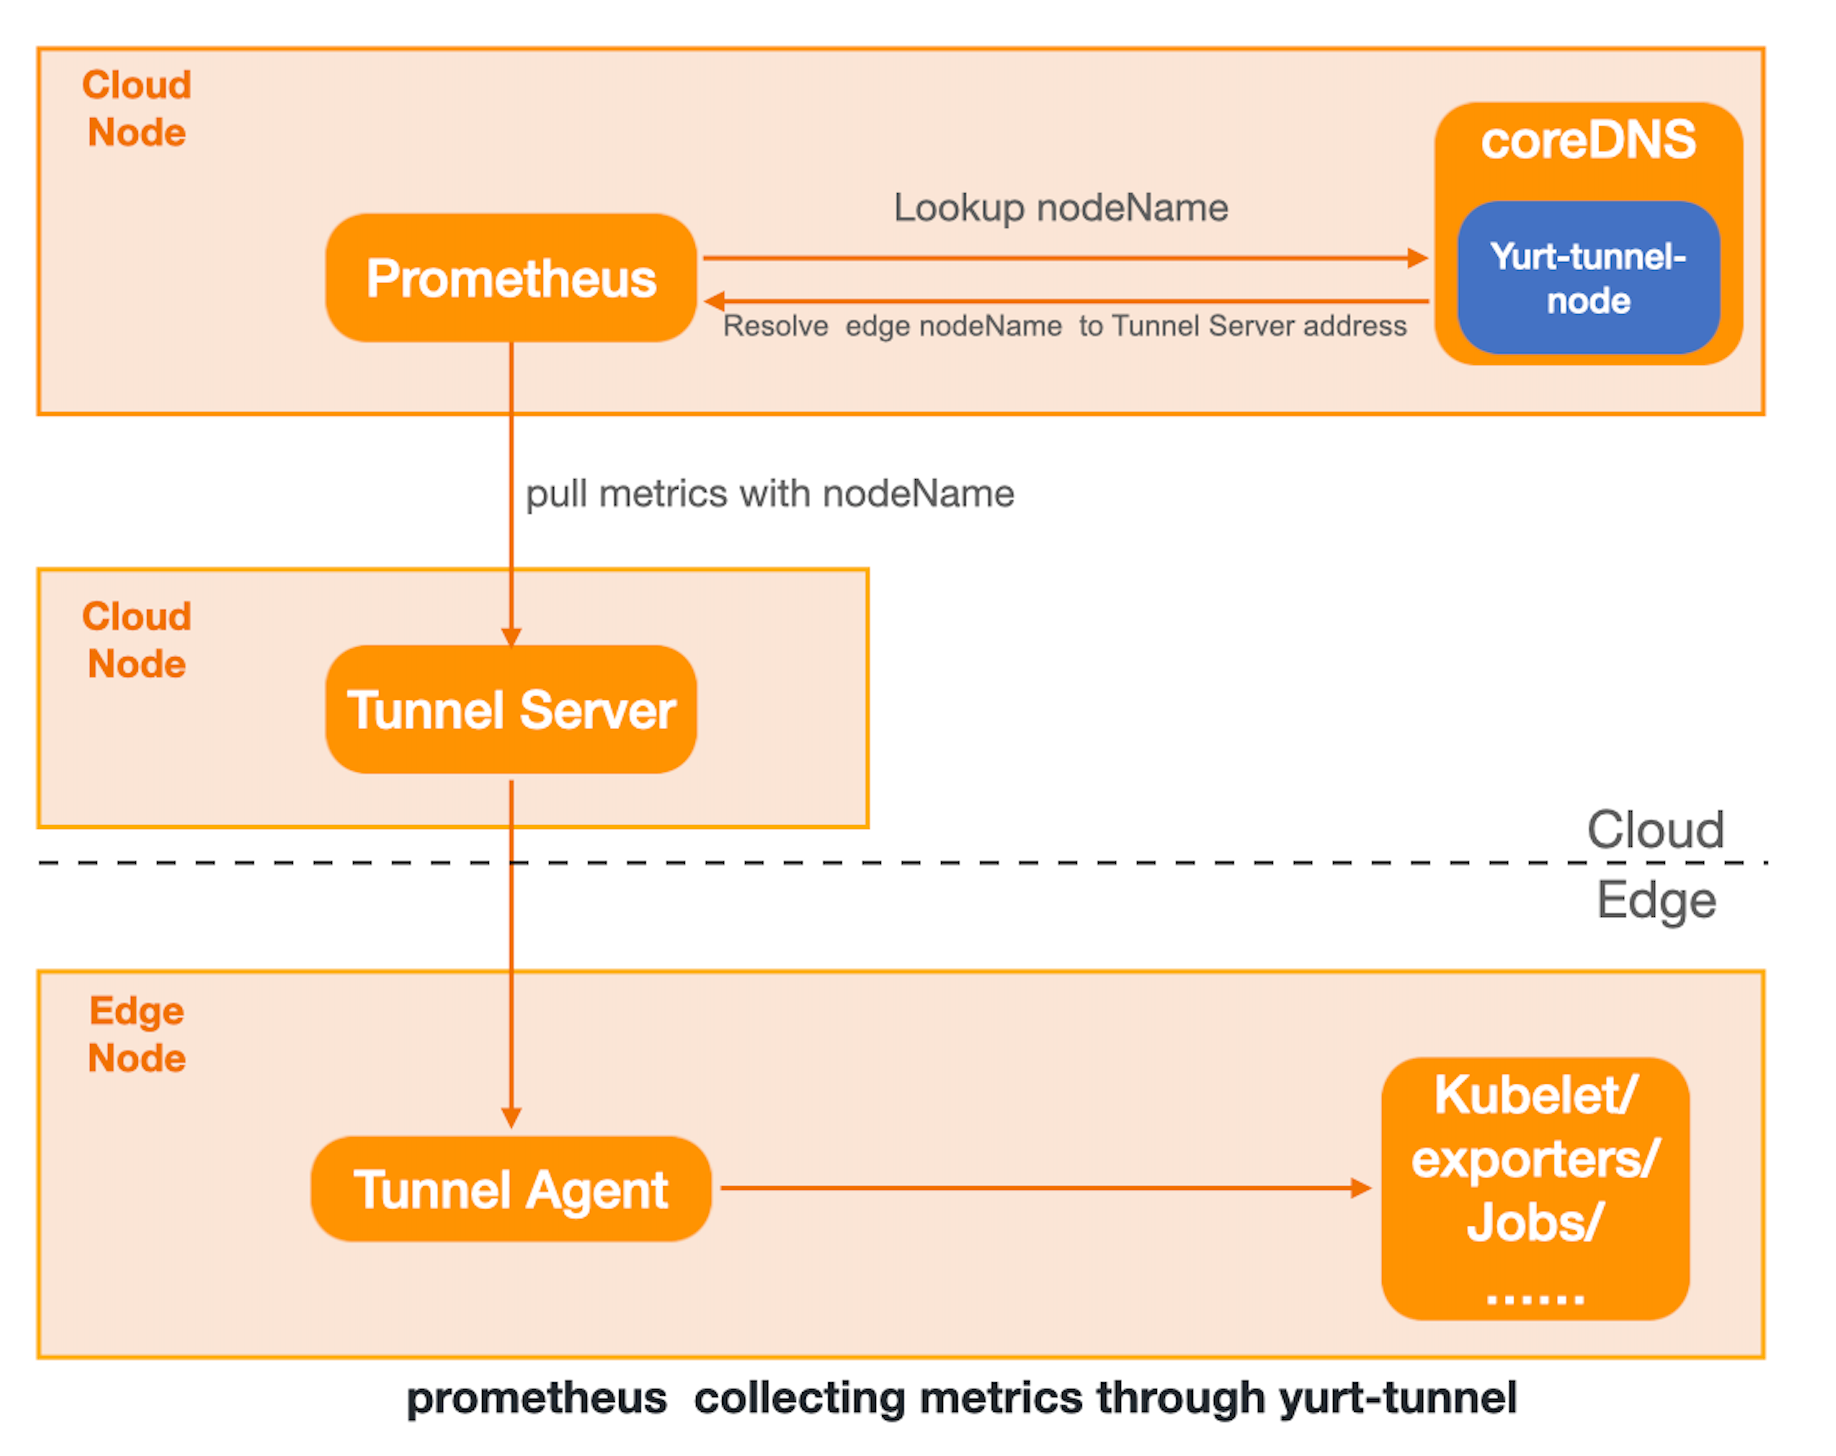
This document demonstrates how to scrape metrics from edge node through Yurt-Tunnel's DNS mode within an OpenYurt cluster.
Environment
-
OpenYurt v0.5.0+
-
CoreDNS v1.6.8+
-
prometheus-operator
If you don't have an OpenYurt on hand, you can use yurtctl to create one or convert from an exist Kubernetes cluster. Installation of prometheus-operator you can refer to kube-prometheus。
1.Modify CoreDNS config
OpenYurt will create yurt-tunnel-nodes ConfigMap,which keeps track of nodename dns records of nodes.
1.mount yurt-tunnel-nodes to CoreDNS
kubectl patch deployment coredns -n kube-system  -p '{"spec": {"template": {"spec": {"volumes": [{"configMap":{"name":"yurt-tunnel-nodes"},"name": "edge"}]}}}}'
kubectl patch deployment coredns -n kube-system   -p '{"spec": { "template": { "spec": { "containers": [{"name":"coredns","volumeMounts": [{"mountPath": "/etc/edge", "name": "edge", "readOnly": true }]}]}}}}'
2.Modify CoreDNS config
use hosts plugin to load dns records in yurt-tunnel-nodes configmap.
$ kubectl edit configmap coredns -n kube-system
...........
 Corefile: |
    .:53 {
        errors
        health {
           lameduck 5s
        }
        ready
        hosts /etc/edge/tunnel-nodes {    # add hosts plugin
            reload 300ms
            fallthrough
        }
        kubernetes cluster.local in-addr.arpa ip6.arpa {
           pods insecure
           fallthrough in-addr.arpa ip6.arpa
           ttl 30
        }
        prometheus :9153
        forward . /etc/resolv.conf {
           max_concurrent 1000
        }
        cache 30
        loop
        reload
        loadbalance
    }
3.Restart CoreDNS
kubectl patch deployment coredns -n kube-system -p '{"spec":{"template":{"spec":{"containers":[{"name":"coredns","env":[{"name":"RESTART","value":"'$(date +%s)'"}]}]}}}}'
2.Config Prometheus
By default, prometheus scrape node metrics with node ip. With relabel functionality provided by prometheus, we can change node ip to node hostname. You can config scrape behavior by modify ServiceMonitor CR.
-
More about relabel config, please refer to prometheus_relabel_config.
-
sourceLabelsneeded differs among components,please refer tokubernetes_sd_config.
收集kubelet的metrics
Add relabel rule in kubelet ServiceMonitor,Use __meta_kubernetes_endpoint_address_target_name to replace node ip:
$ kubectl edit serviceMonitor kubelet -n monitoring
spec:
  endpoint:
    ..........
    relabelings:
    - action: replace  # add relabel rule
      regex: (.*);.*:(.*)
      replacement: $1:$2
      sourceLabels:
      - __meta_kubernetes_endpoint_address_target_name
      - __address__
      targetLabel: __address__
    ..........
scape other metrics(take node-exporter as an example)
Yurt-tunnel will only do forward for port 10250 and 10255, if you want to add forward for other ports, you can modify yurt-tunnel-server-cfg ConfigMap.
For node-exporter, you may need to add 9100 to https-proxy-ports。If you want to add http forward, just modify http-proxy-ports.
modify yurt-tunnel-server-cfgConfigMap
kubectl patch configmap yurt-tunnel-server-cfg -n kube-system -p '{"data": {"https-proxy-ports":"9100"}}'
Add relabel rule in node-exporter ServiceMonitor,use __meta_kubernetes_pod_node_nameto replace node ip:
$ kubectl edit servicemonitor  prom-kube-prometheus-stack-node-exporter
spec:
 endpoint:
   ......
   relabelings:
    - action: replace #add relabel rule
      regex: (.*);.*:(.*)
      replacement: $1:$2
      sourceLabels:
      - __meta_kubernetes_pod_node_name
      - __address__
      targetLabel: __address__
    ........