prometheus
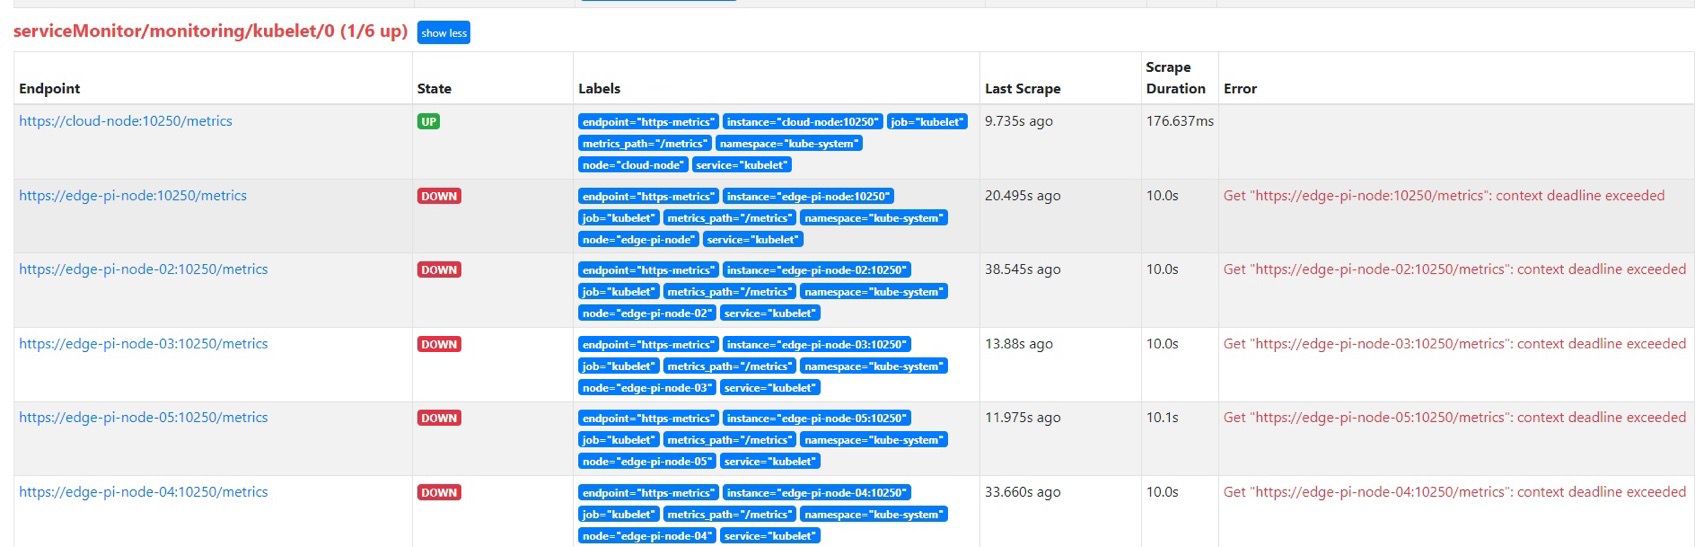
1. prometheus cannot get the edge node metrics
prometheus cannot get edge node metrics
Troubleshooting method
- Log in to the node where the prometheus-pod is located, and check the running log of the prometheus container
$ crictl ps -a
$ crictl logs $containerID<b9a9f9d9fdb1e>

- check the prometheus container DNS configuration file resolv.conf to obtain the domain name resolution server address
crictl inspect $containerID<b9a9f9d9fdb1e>

$ cat /var/lib/containerd/io.containerd.grpc.v1.cri/sandboxes/ebdbfc2212eb1390f24f02445e7737c62421c84caef92623/resolv.conf

Get the domain name server nameserver address of the prometheus pod
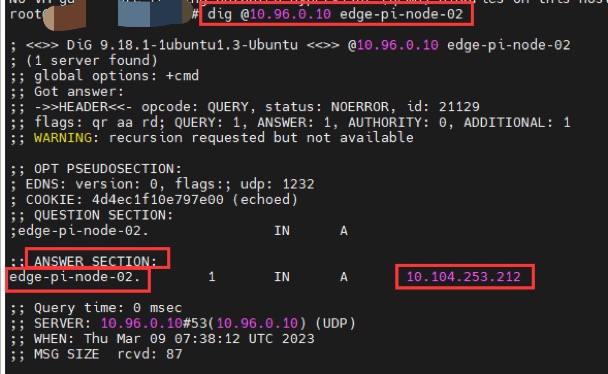
- Use the
digcommand, set the domain name resolution server to thenameserveraddress of prometheus, resolve the domain name that the service cannot access, and get the corresponding resolved ip
$ dig @10.96.0.10$ Unreachable service domain name <edge-pi-node-02>
If there is no
digcommand, install the dns toolkit according to the corresponding system as follows$ apt install dnsutils #ubuntu system
$ yum install bind-utils #centos system
- replace the unreachable service domain name with the ip address just resolved in
curlcommand and check if it can be accessed
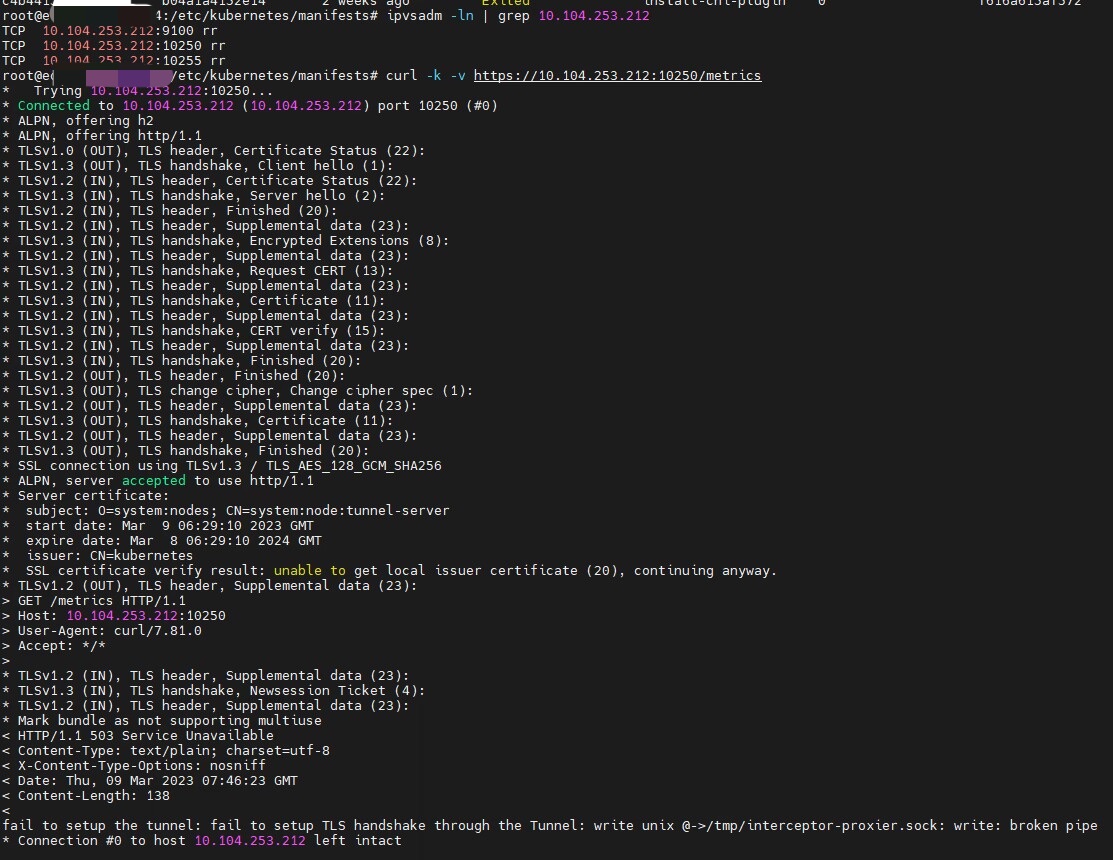
https://edge-pi-node-02:10250/metrics is replaced by: https://10.104.253.212:10250/metrics
$ curl -k -v https://10.104.253.212:10250/metrics
If it can be accessed normally, the result of the curl command is as follows, and the node in ipvs mode should have created a virtual service forwarding rule corresponding to the ip